

nvestIQ is a next-generation investment platform that transforms how retail investors manage their portfolios. We designed and developed a comprehensive dashboard with modular widgets, smart categorization, and big-screen-ready financial visualization. The platform empowers users with real-time market data, AI-driven insights, and intuitive portfolio tracking tools that simplify complex financial decisions.
Assemble Date : 10/01/2025
Delivery Date : 10/05/2025
Presenting large volumes of real-time financial data in a way that is intuitive and actionable for retail investors was a core challenge.
The dashboard needed to handle thousands of concurrent users fetching live market data without performance degradation.
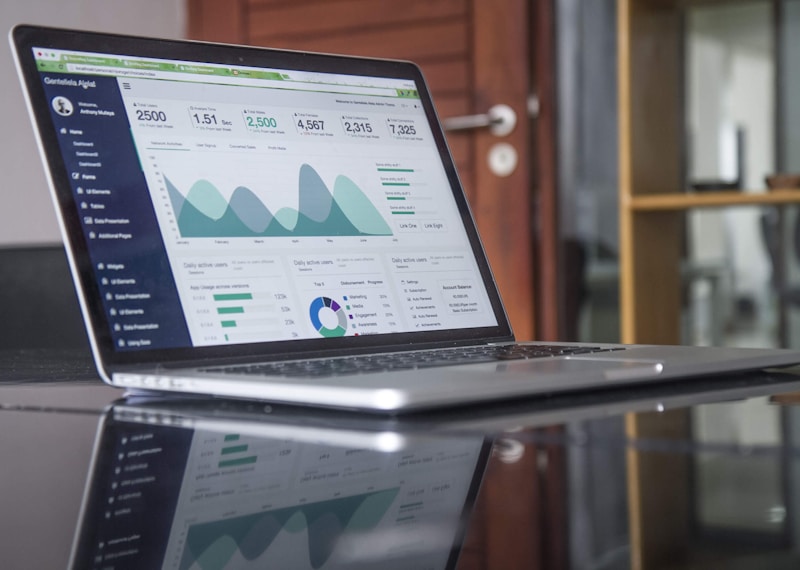
Users needed a seamless experience across mobile, tablet, and large-screen displays including TV-sized dashboards.
We built a drag-and-drop widget system where users customize their dashboard layout, choosing only the data views they need.
Implemented WebSocket-based real-time data pipelines with intelligent caching and lazy-loading to maintain performance under load.
Designed a fluid layout system that adapts beautifully from 375px mobile screens all the way up to 4K wall-mounted displays.
Onboarded more than 12,000+ active investors within the first 3 months of launch.
Average dashboard load time reduced to 0.8s through optimized data pipelines.
Real-time portfolio sync maintained at 99.9% uptime across all markets.
Month-over-month user retention rate of 78%, well above industry average of 40%.
After we made our high-fidelity wireframes, we made a design system with rules for each design element, such as visual identity elements, icons, interface components.

Built with modern technology and best practices to ensure your success
Live sync with market data feeds to show up-to-the-second portfolio valuations and P&L across all asset classes.
Drag-and-drop dashboard builder with 20+ pre-built financial widgets including charts, tables, and heat maps.
Machine learning models analyze market trends and surface personalized investment opportunities and risk alerts.
Unified view of stocks, ETFs, crypto, bonds, and commodities all within a single connected dashboard.
Dedicated TV and monitor display mode designed for trading floors and home office big-screen setups.


Got questions? We've got answers.
The timeline depends on the project's complexity, features, and required integrations. On average, small-to-mid development takes 2–10 weeks, while larger systems may require 4–8 months. Before starting, we provide a detailed project roadmap of how long it will take.
Yes, we offer end-to-end services including UI/UX design, prototyping, and full development. Our design team works closely with developers to ensure pixel-perfect implementation.
Absolutely. We build all solutions with scalability in mind, using modern architecture patterns and cloud-ready infrastructure so your software can grow with your business.
Yes. We offer flexible maintenance packages including bug fixes, feature updates, performance optimization, and 24/7 technical support to keep your software running smoothly.
Yes. We specialize in third-party integrations including CRMs, ERPs, payment gateways, APIs, and legacy systems to ensure seamless connectivity across your tech stack.
We follow industry security best practices including data encryption, secure authentication, regular vulnerability assessments, and compliance with standards like OWASP to protect your software and data.
Feel free to customize your reports. Utilize our super-table instead of exporting and importing data over and over.
Get in on the action. We are always ready to assist you.